2025/12/15
Previous week
Organise my notes
- I created this repository to store and share my notes easily.
- I will also use it to make slides/reports, so this will centralise most of the information I gather and make it easier to reuse it.
Get access to a cluster to train ML models
- Jean Zay used by the IGN won’t be available to me until my internship at the IGN officially starts
- TU Delft has DAIC and DelftBlue, DAIC being probably the most promising since focussed on AI. I filled the forms to get access and both of them were approved so I should now have access. However, both are in maintenance so I won’t be able to try until December 17th.
Create our own point cloud dataset with AHN and 3DBAG
Exploration
- Looked at (Mérizette et al. 2025) which explains how they created a new dataset for semantic segmentation of indoor TLS with two different processes: manual labelling and automatic generation of pseudo-labels from a BIM model of the objects. For the automatic generation, they basically made their own 3D BIM model of the rooms, and then used this data with the associated classifications of objects to classify points that were inside the BIM models to the corresponding category.
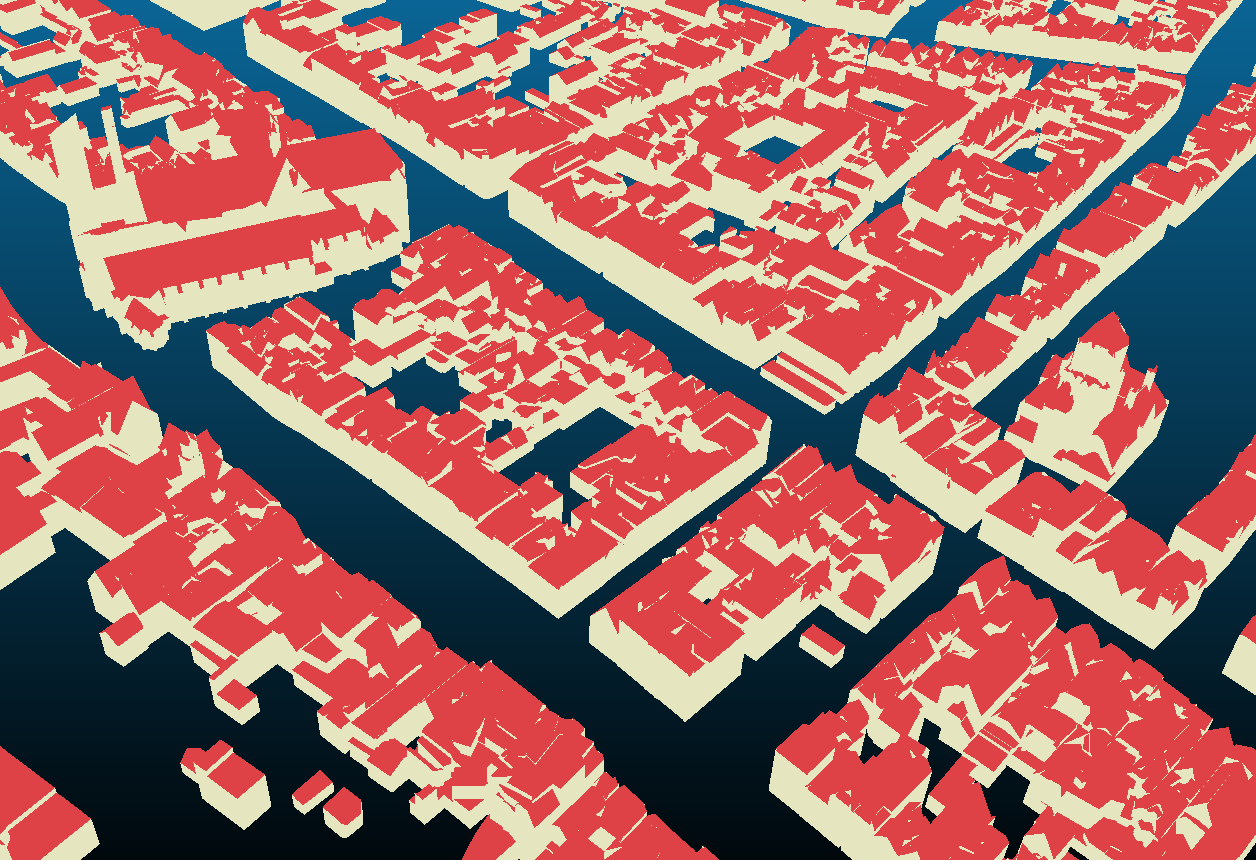
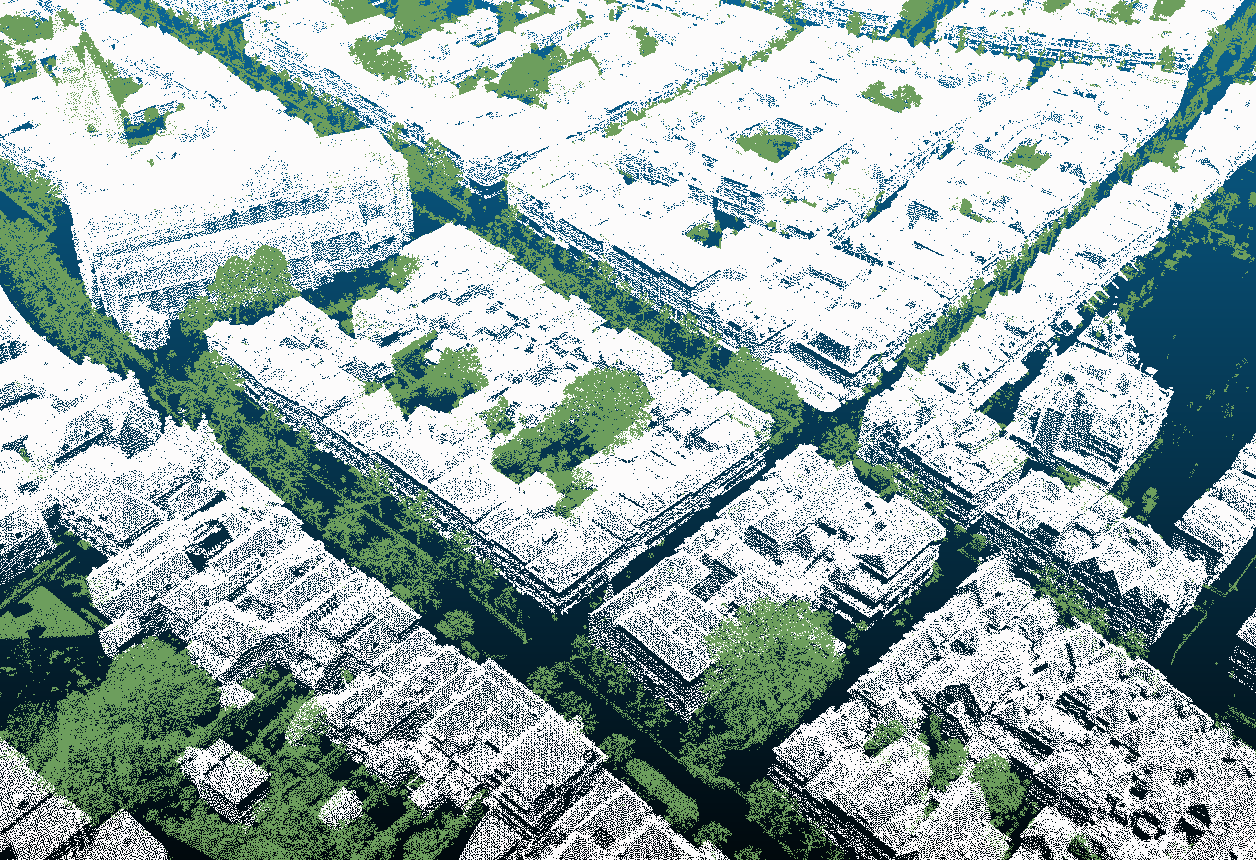
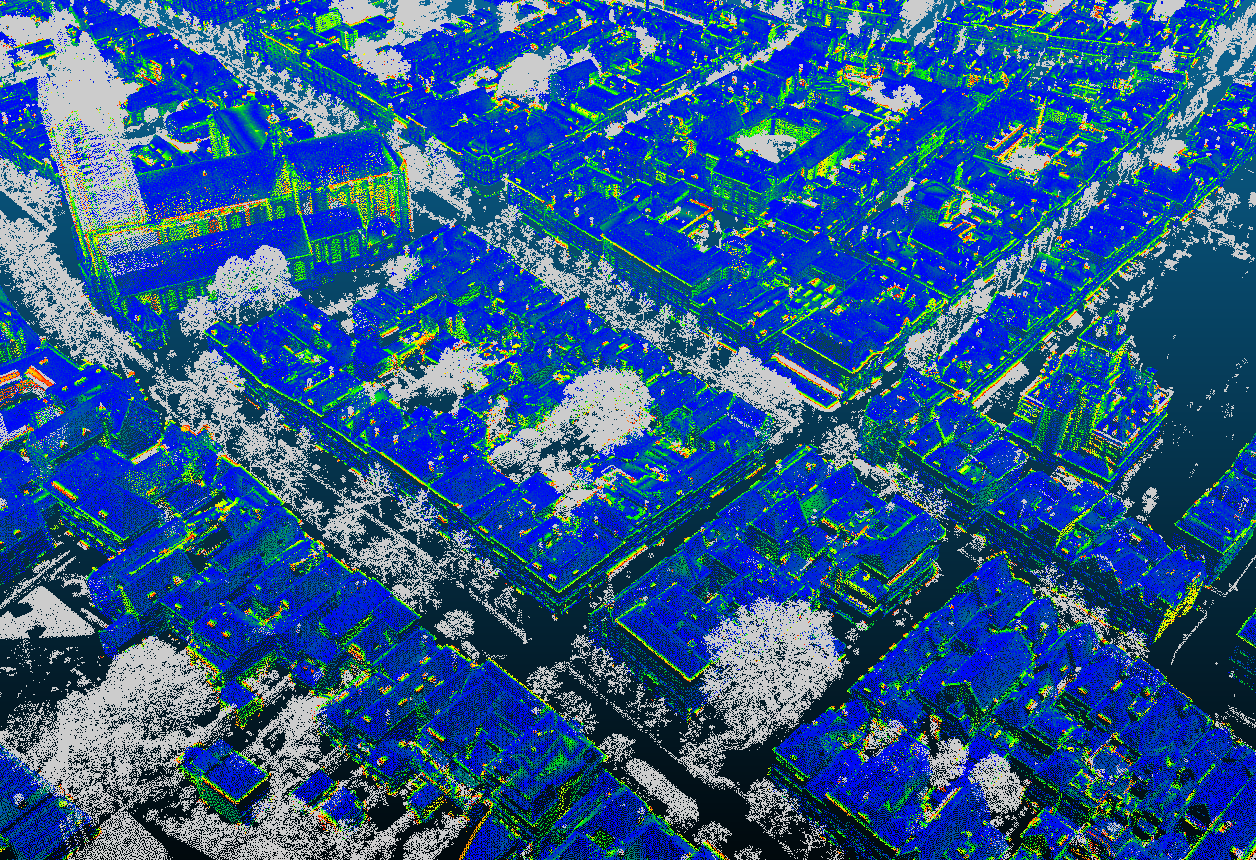
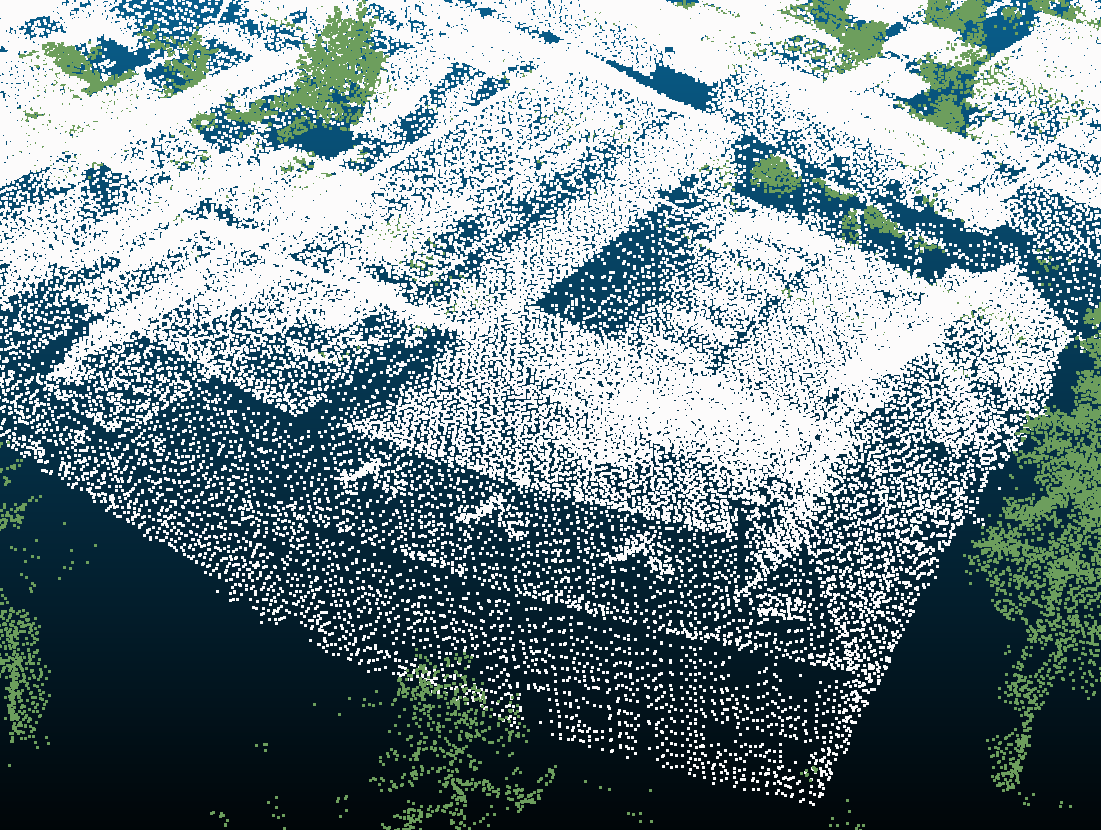
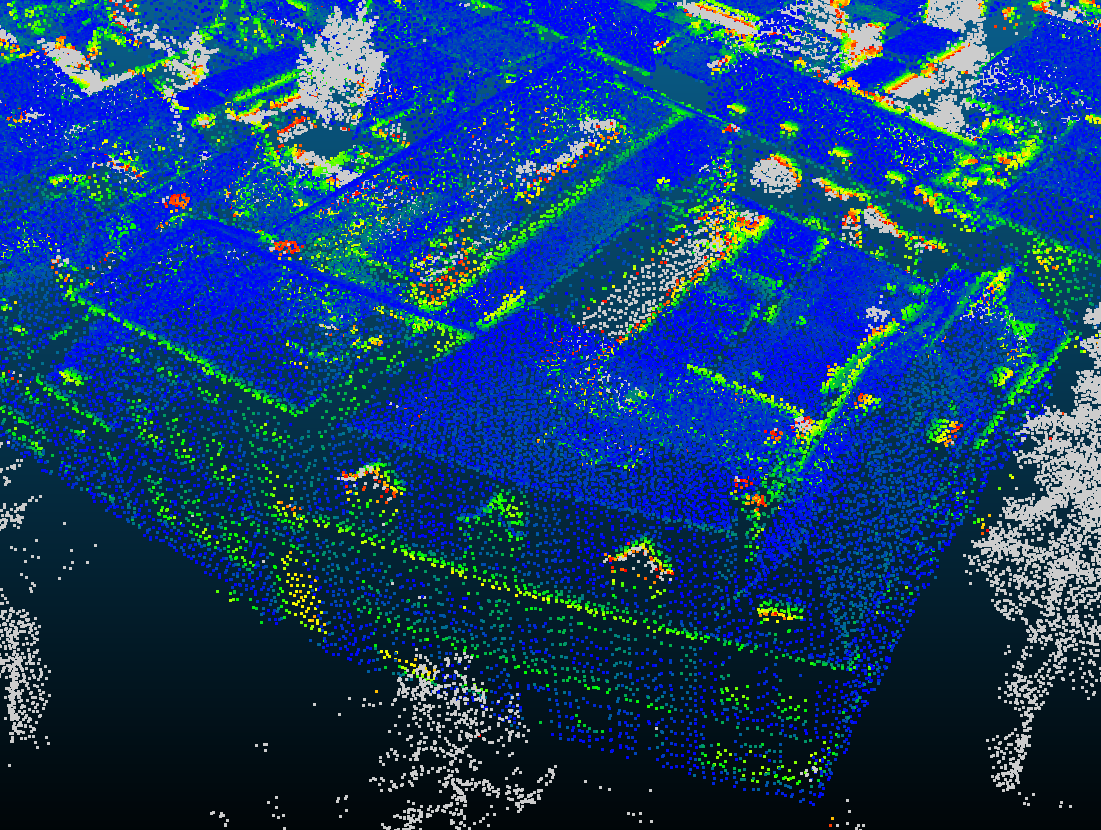
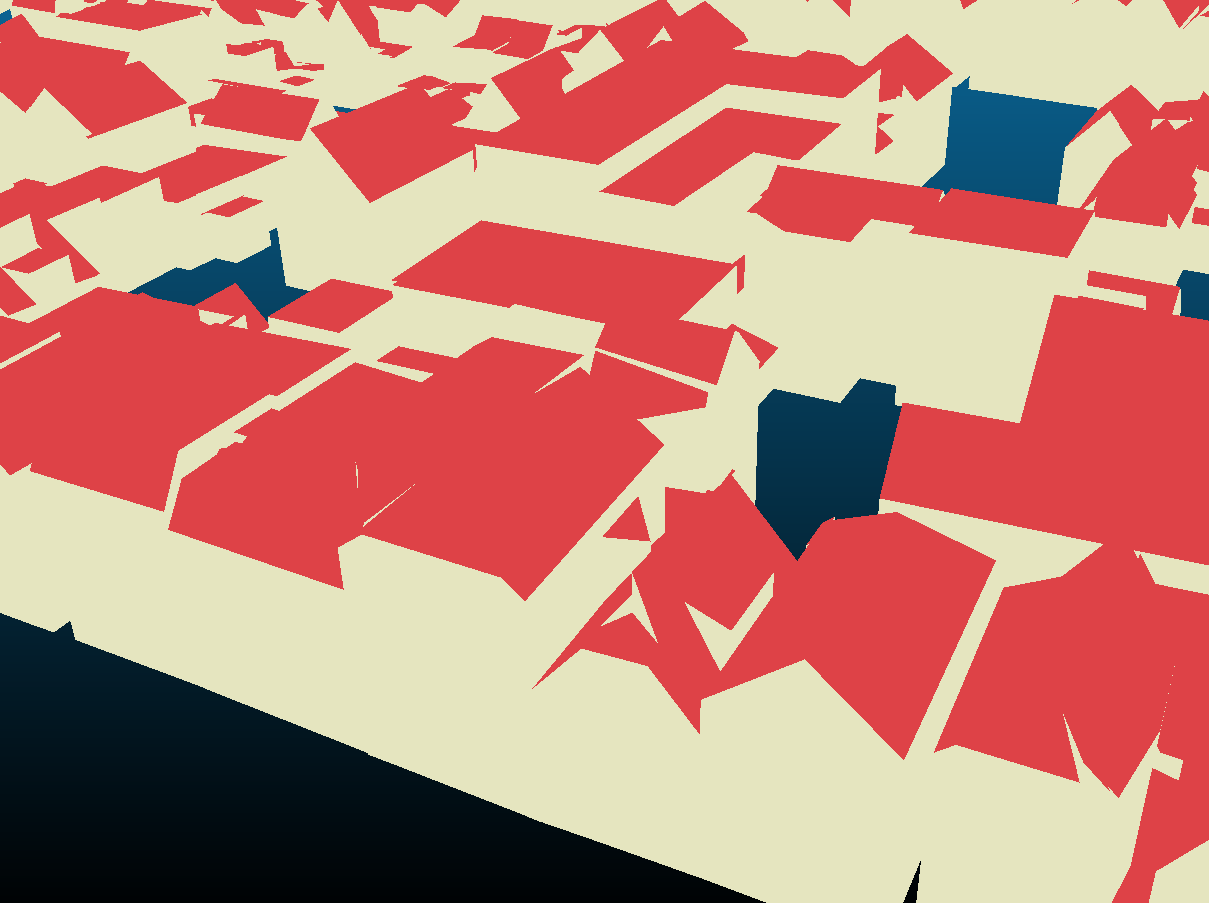
- Looked at the coherence between the LoD 2.2 buildings from 3DBAG with the AHN4 point cloud in the center of Delft. Most points in the dataset seem to be close and accurate, with different precision depending on the case:
- Roof points are mostly close to the building with 0.1 m precision
- For façades there is more variation, but mostly up to 0.5 m,
- Then there are more complex situations like balconys, chimneys and other details that are not represented in the 3DBAG and are therefore further away
- Monuments (such as churches and fancy buildings) and new buildings also give bad results
Implementation
- Had quite a few issues in:
- Handling the OBJ files from the 3DBAG. Is there a simple tool that could be used to simply merge multiple OBJ files? I made a simple Python script with
trimeshto separate the building faces per type (floor, façade, roof). - Handling the LAZ files from AHN4. AHN tiles are actually quite big so I couldn’t load them entirely with
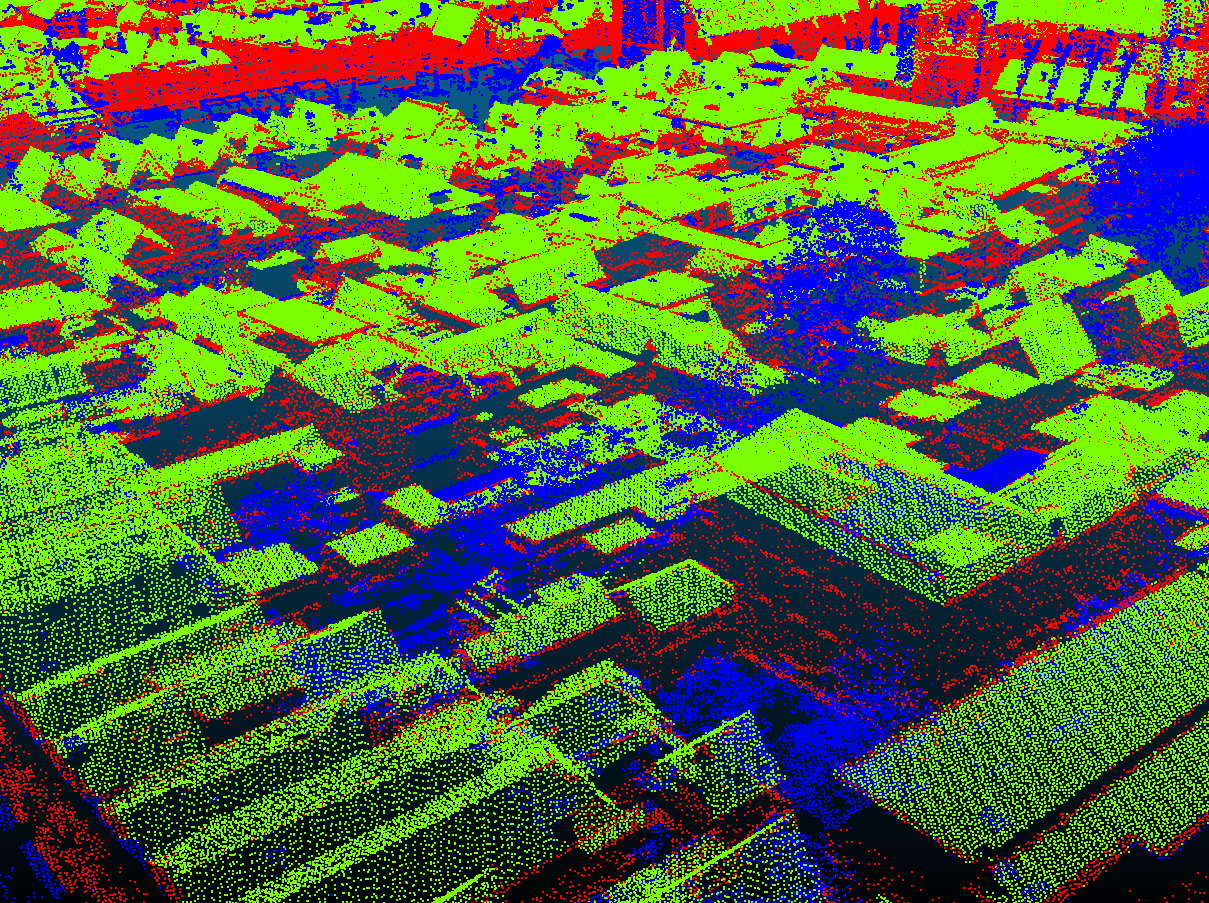
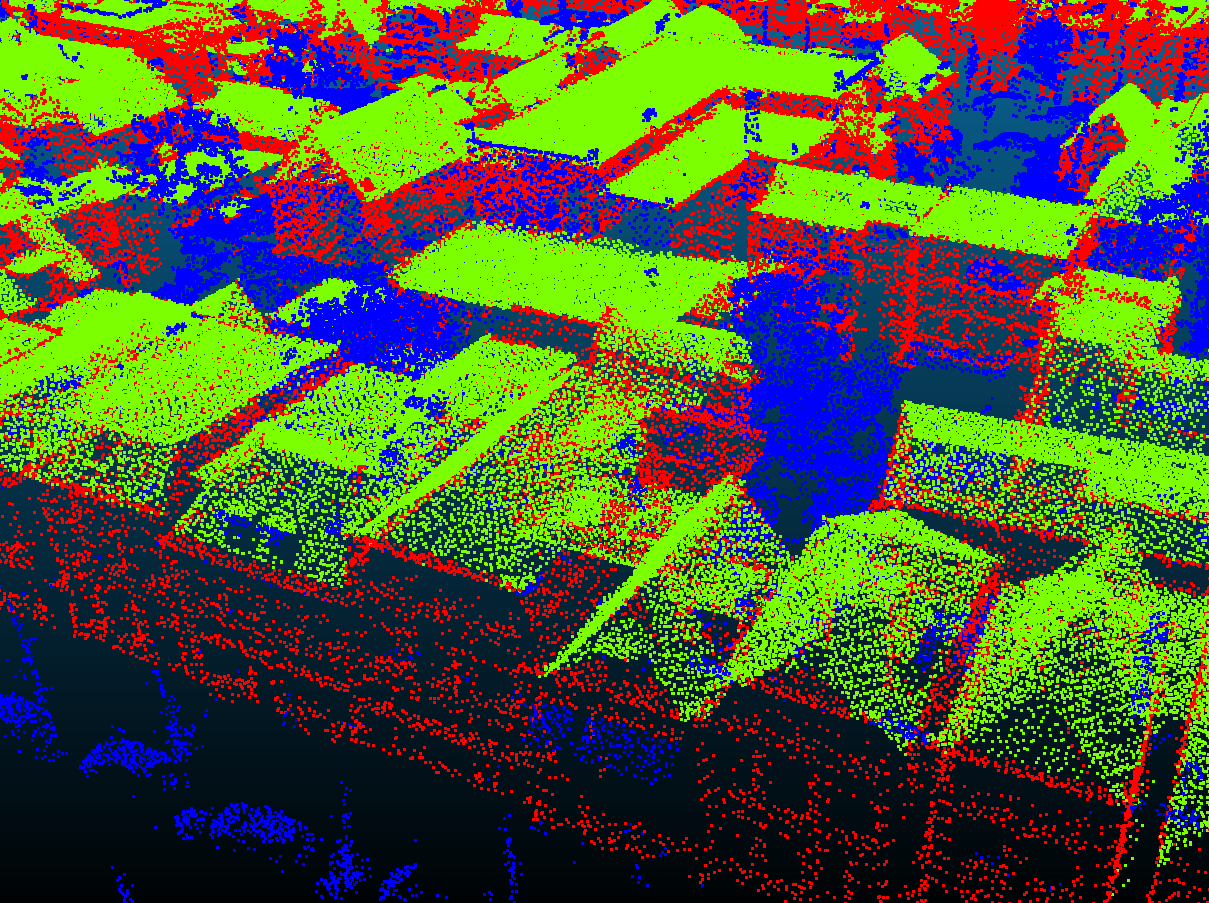
laspy. I tried to usetrimeshin Python to compute the distance from point cloud to mesh for each class, but it was very slow compared to CloudCompare. So I did all the computations using CloudCompare, and then classified with simple thresholds: 3 classes (roof, facade and other) withroofbeing assigned to the point \(p\) if \[\text{distance}(p, \text{roof}) < \min(\text{distance}(p, \text{facade}), 1)\]
- Handling the OBJ files from the 3DBAG. Is there a simple tool that could be used to simply merge multiple OBJ files? I made a simple Python script with
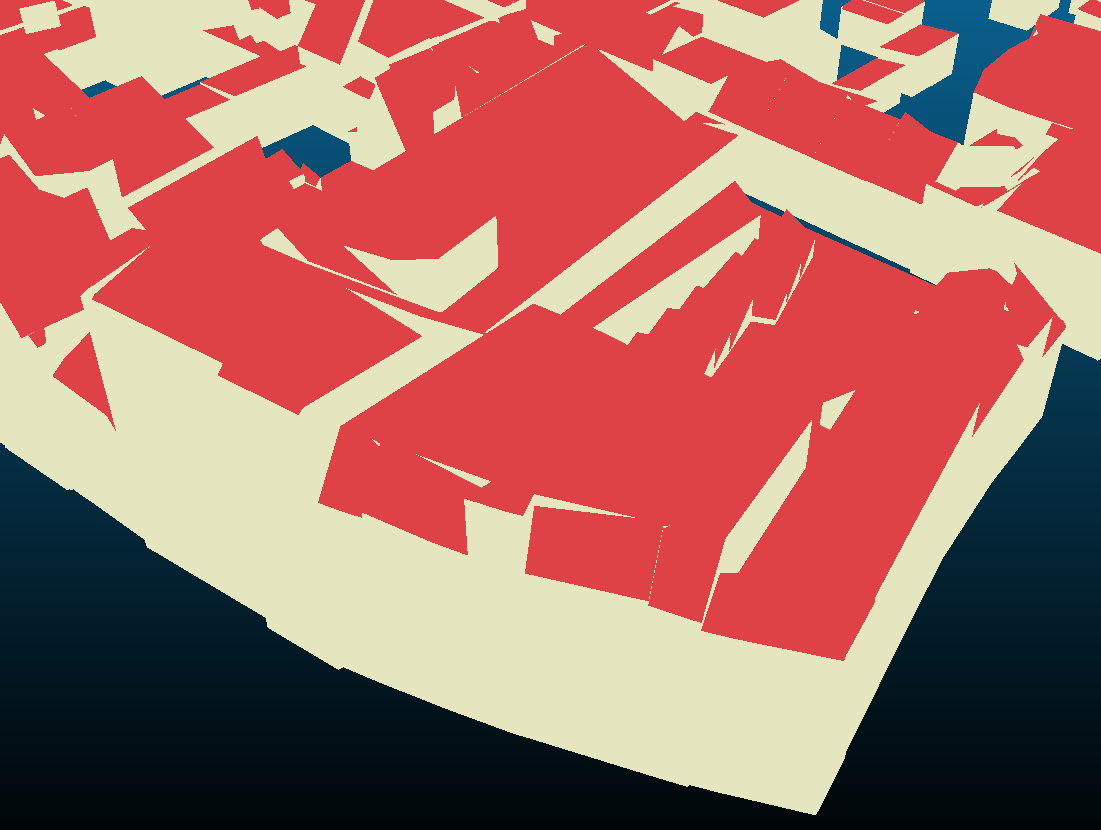
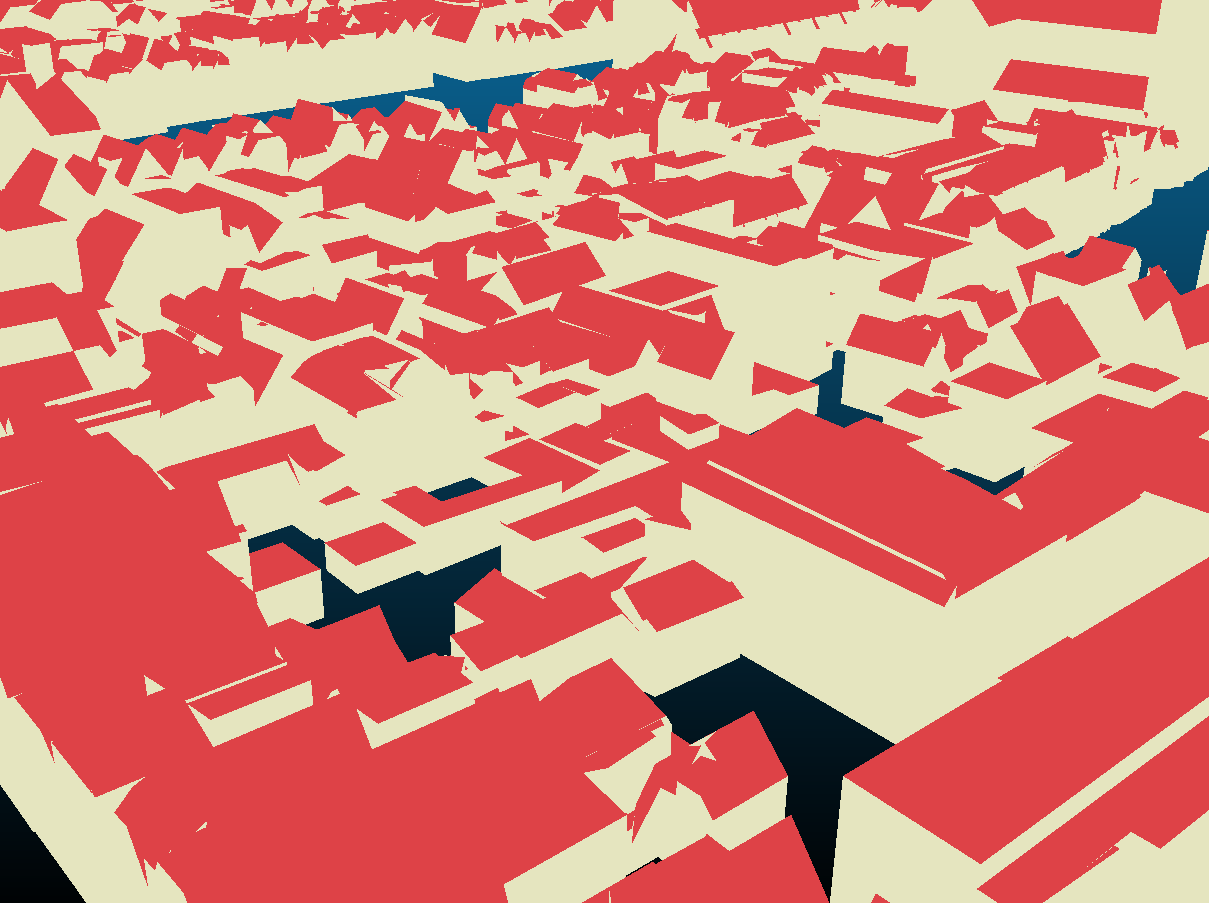
- Still the results look promising, with a few edge cases, some of them that could be interesting:
- Most of what is not included in the LoD 2.2 models is not classified: balconies, chimneys, dormers and in general all the objects on the roofs or on the walls.
- Roof overhangs and/or the boundaries of the roofs are sometimes/often classified as façades because the LoD 2.2 models don’t expand far enough on the sides. This could maybe be improved by expanding the roof polygons?
- As expected monuments and modified buildings also perform poorly
myria3d
Looked quickly into myria3d:
- Could be quite interesting to train a custom model on custom data, since it seems like a nicely documented framework.
- However, their model expects to have RGB values for the point cloud, which seems to be computed from aerial images, so AHN doesn’t have it but we could maybe compute it.
Polygonal output for ML model
Looked at (Girard et al. 2020), an interesting paper that tries to predict building edges as polygons using a ML model. To do so, their model takes a RGB image as input and outputs two things:
- 2 values predicting:
- if the pixel is in a building
- if the pixel is on the edge of a building
- 4 values defining two complex numbers that define two directions for each pixel. All the pixel then make a frame field that defines tangents/normals of buildings
Then, the frame field and the classification rasters are processed in different steps:
- ASM optimization to get a sub-pixel precision and straight edges aligned with the frame field
- Corner detection
- Corner-aware simplification
- Polygonization
- Polygon filtering
I haven’t read all the gory details in the supplementary material but it is nice that it is there, and there is also a repository.
They get nice results with clean polygons, and I think it could be extended to point clouds as the frame field could also make a lot of sense there, by also predicting a classification coupled with a frame field.
However I don’t know how this could help with the differentiation footprint/roofprint if we don’t have any training data with both.
Re-use of current BD TOPO building outlines
- A simple way to re-use BD TOPO building outlines could be to use them to extract smaller point clouds (with a margin around the current outline like 5 m to take the current errors into account), that would be quicker and easier to process
- Skimming through (Wierzbicki, Matuk, and Bielecka 2021) gave me the idea that images (which should be well geo-referenced), could maybe be used in combination with current outlines to extract regions of interest to process the point cloud
- Skimming through (Saadaoui et al. 2025) made me realize that the roofprints obtained from aerial images are not at the right position due to the angle of the camera, which could be part of the reason why the current outlines are not correct
Discussion
- The automatic classification of AHN based on 3DBAG seems very pormising and we should try to make it happen
- There is a large area in Marseille with hand-made 3D buildings based on LIDAR HD that I could use once I join the IGN for the internship (because it is closed data)
- Geotiles has AHN 4 et 5 with RGB values for orthophotos, but it is not really relevant in our case because it does not work well on façades